VPCsim
Virtual Plant Community Simulation (VPCsim)
 We are simulating a virtual plant community so students can explore the effects of the environment and human disturbance on living things and engage in science inquiry. Students create a community by selecting species and control the environment and levels of human disturbance. The community is then simulated over 200 years so students can view changes and collect data about how the plant community is affected over long periods of time.
About the Science:
This simulation is based on a cellular automata model of competition. The probability of a plant being replaced by a plant of another species is based on:
- Plant fitness within its environment,
- Competition and local dispersal, and
- Less common long-distance dispersal.
Students control the environment, the initial plant community, and the levels of human disturbance. They can compare simulations under different conditions to perform experiments that would not be feasible using an actual plant community. We are using this system to help middle school students answer questions about how the environment and human activities affect organisms such as:
- How do different types or levels of disturbance affect communities?
- How does a changing environment affect communities?
- What makes a species invasive and how does that affect existing organisms?
- How does the size or distribution of conserved habitat patches affect organisms?
About the Technology:
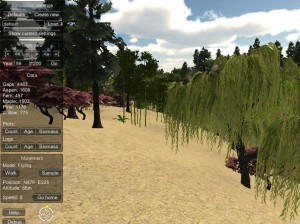
VPCsim was built using Unity3D, a gaming platform that allows you to create 3-dimensional virtual environments that run in a web browser. The community is displayed as 3D virtual plants growing on a mountainous terrain. Students use keyboard controls to walk or fly through the simulation, and can also travel through time to see how the plant community changes. Through a webform they control:
- the environment (water, temperature, and light levels)
- the plant species included in the community
- the initial layout of the community (which plants are in which locations)
- locations of permanent human impacts (buildings, roads, etc.)
- levels of ongoing temporary human disturbance
Statistics are displayed on a heads up display (HUD) and data about the community is plotted and logged so students can analyze how the community changes over time.